When is a product actually a good deal?
When you buy tech, you rarely see the “fair” price—you see today’s price. Whether an offer is good only becomes clear from price development: the price history, the historical low, and whether the price is genuinely dropping or only dipping below an inflated reference.
Why the current price alone is not enough
A list price is a snapshot. It does not tell you whether the product was regularly cheaper in recent weeks, whether the market is in a promotion phase, or whether a discount badge only compares against an artificially high MSRP.
Comparing prices over time answers different questions than a same-day shop comparison: Is the price in the lower part of the historical price data? How far is it from the captured low? Is the trend rising or falling? Only then does the question of when to buy become answerable at all.
Why many discounts are misleading
Percentage badges feel convincing because they assume a reference price you rarely check. Retailers can raise MSRP, cut briefly, and still sit above the product’s usual historical range.
- Inflated MSRP: Strikethrough prices that were never the regular selling price.
- Short promotions: One or two days below average—then back to expensive.
- Missing context: “−20%” means little if the price was often lower in prior months.
- Percentages over history: A historical low is more informative than any percentage badge.
If you only read badges, you confuse marketing with market price. If you read the price history, you see whether the price is really falling—or only looks that way briefly.
How product prices typically develop
Most categories follow recognizable patterns: launch prices start high, step down over time, react to seasonality, and later stabilize at a lower level. Smartphones, laptops, and refurbished devices show this especially clearly.
- Release cycles: After a model refresh, predecessors often come under pressure—prices drop over weeks, not in a single day.
- Promotion windows: Black Friday, year-end sales, and shop campaigns create temporary lows.
- Price cycles: Higher and lower levels alternate—rarely a straight line.
- Refurbished vs. new: Separate markets, separate refurbished price trends—a new price is not a benchmark for refurbished offers.
How much do tech prices really fluctuate?
Smartphone prices can move by double-digit percentages within a few months—depending on model and demand— especially shortly after launch, before successor announcements, and during sale periods. Volatility is rarely random: it follows release cycles, stock levels, and competition between platforms.
- New prices: Often highest volatility after launch; then gradual normalization.
- Refurbished: Its own range—driven by grade, seller, and stock; can fall faster than new prices.
- Seasonality: November and year-end sales move many electronics prices; not every “low” is a new historical low.
- Price volatility: High swings mean averages mislead. A single low can disappear within days.
Market observation: A price that stays below average for several weeks is analytically more valuable than a one-day low during a 48-hour promotion. That distinction separates real buying opportunities from short-term marketing.
What historical lows really mean
The historical low is the lowest captured price in the available period— not a promise it will return, but the strongest anchor in the analysis. If the current price sits well above it, the offer is relatively expensive over time, even when a discount badge suggests the opposite.
What matters is how often the market sat near that low: a one-off downward outlier is less relevant than a level that keeps coming back. For refurbished iPhones, that applies to the refurbished track— not the new price of the same model.
When to buy—and when to wait
The best time to buy is rarely a single day. What matters analytically is a level: price near a historical low, below average, in a falling or stably low trend—and the offer matches your needs for condition, warranty, and shop.
- More likely to buy: Price in the lower historical range, flat or falling trend, no spike before a known sale period.
- Rather wait: Price clearly above average; shortly after an artificial discount; volatility suggests upcoming promotions.
If you want to wait for a specific level, you can use price alerts to get notified when the price drops and crosses a threshold you set.
Example: iPhone 15 Pro price development
The iPhone 15 Pro illustrates typical market movements well. Exact amounts vary by storage, condition, and shop—but the patterns repeat:
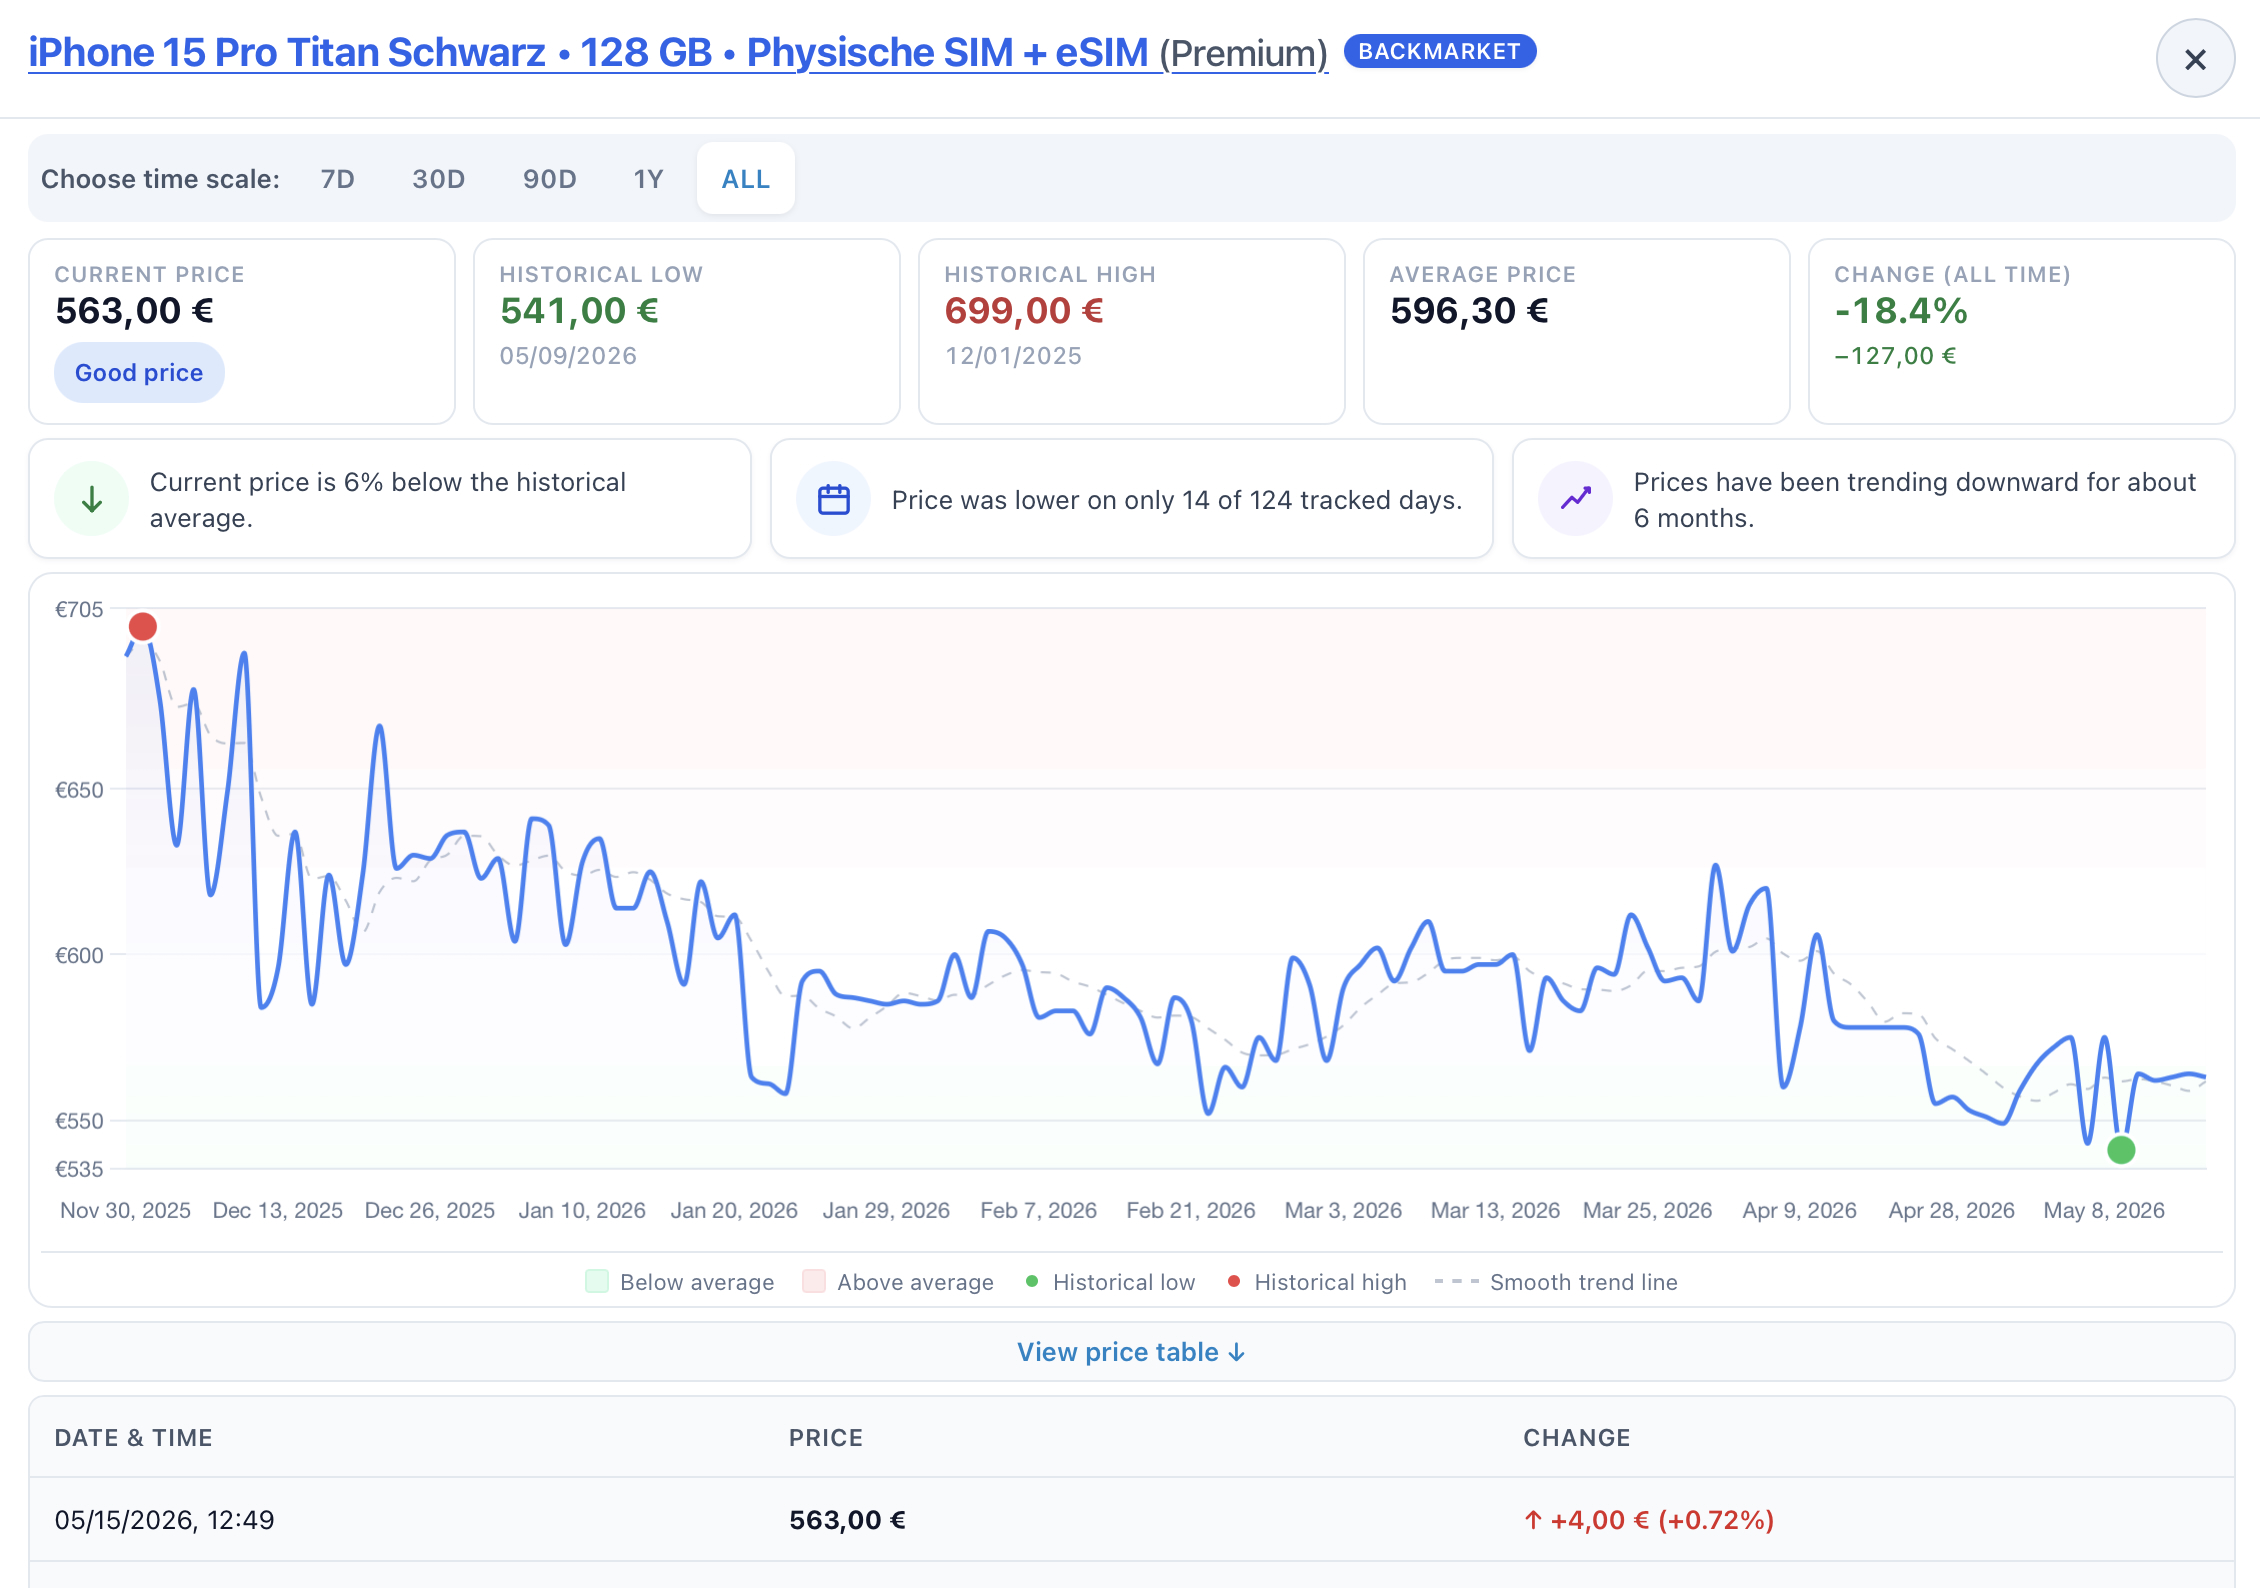
Phase 1 – after launch: The price dropped noticeably from the introduction level, then stabilized on a higher plateau and only reached a new historical low months later— often tied to sale periods or successor rumors.
Phase 2 – apparent discount: An offer with “−15%” can still sit above the long-term average in this phase. The discount refers to MSRP, not the captured price history— so the price looks cheap even though it is analytically expensive.
Refurbished parallel market: Refurbished models move on their own level, usually well below new prices, with their own volatility by grade. If you only compare new prices, you often miss the cheaper buying window in refurbished.
These histories can be tracked per listing in the price tracking dashboard—including historical data, average, and trend. More on the refurbished market: buy a refurbished iPhone.
Common questions about price analysis
When do iPhone prices typically drop?
Prices often move more after new model launches, during sale events such as Black Friday, and when refurbished listings come under pressure. There is no fixed calendar day— what matters is the price history of the specific model.
What counts as a good historical price?
A price in the lower part of the tracked range—near a historical low or clearly below the average. That gives statistical context for comparing prices over time, but it does not replace checking availability, condition, and shop terms.
Why are some discounts misleading?
Because percentage badges often rely on inflated reference prices and short promotions that hide a permanently high baseline. Without historical price data, a discount can look cheap even when the price is only average or expensive in its own history.
How do you spot the best time to buy?
When the price sits near a historical low, stays below average, and the trend is not spiking upward just before a known sale period. The cheapest buying moment is rarely a single day—it is more often a level that repeats over weeks.
Why is the current price alone not enough?
Because it captures only one moment. Price development, historical lows, and volatility show whether an offer is genuinely attractive over time—or only looks good compared with an inflated reference price.
Price information and availability may change. The merchant's price is always authoritative.
Start tracking prices with Pricewatcha
Create a free account, add your first product link and monitor prices across shops with alerts and price history.